
I have been having a recurrent nightmare in the Statistics class I’m teaching. The nightmare goes like:
We used an independent sample t-test and found a significant correlations (t(df)=…).
It also comes in the shape of non-significant data, maybe even more haunting than the first version.
We found a non-significant difference between Factor level A (M= …, SD= … ) and Factor level B (M= …, SD= …), meaning there is a negative correlation between Factor and response variable.
These phrases are not actual statements made by my students on paper but they come quite close. I have been trying to wrap my head around their confusion between correlation and t-test, which persists even though I remove points on papers and make announcements in class. It persists whether I repeat the material from a different angle, draw stuff on the board, and have face to face interaction with firm believers of the t-correlation theory. I have made frustrated comments during TA meetings only to find that other TAs experience the same issue. One of the TAs was adamant about it, she even makes them sing! But the confusion is still intact.
How to
It’s not my full intention to preach about what a t-test or a correlation analysis are (although see below). I’m trying to figure out what makes students be so confused about these two. More thoughts on this topic will come in the near future.
Two different worlds
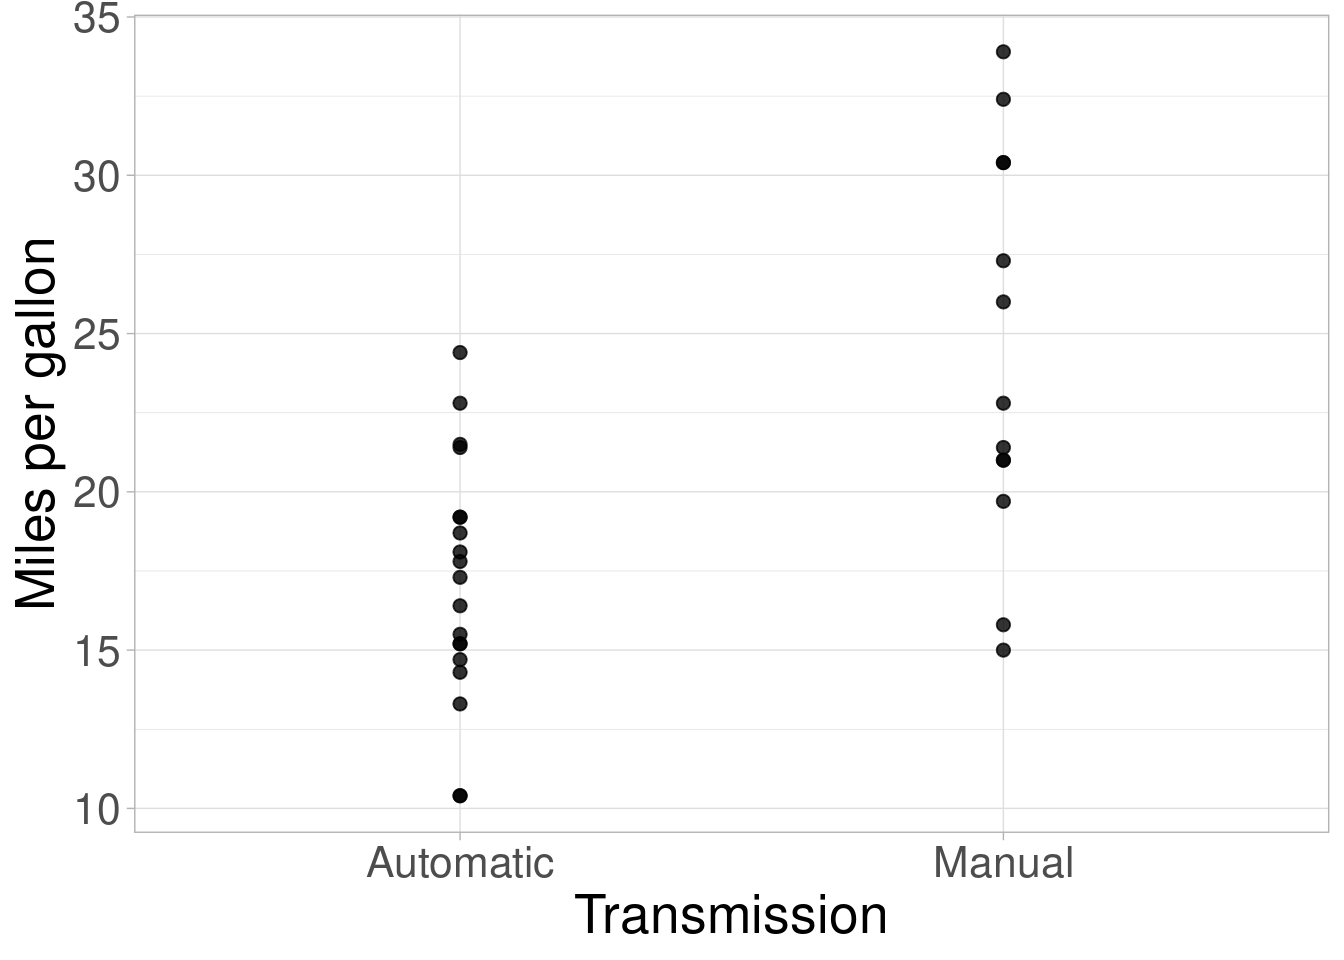
Correlation and factor analysis are essentially different. Continuous vs discrete. A car’s transmission can be automatic or manual. There is no scale, no range of values. We can study how a continuous variable (such as miles per gallon) is affected by the type of transmission.
Moreover, we are trying to collapse the groups into a comparison of their means, standard deviations, and N. But let’s focus on the means, let’s reduce the previous scatterplot to two dots.
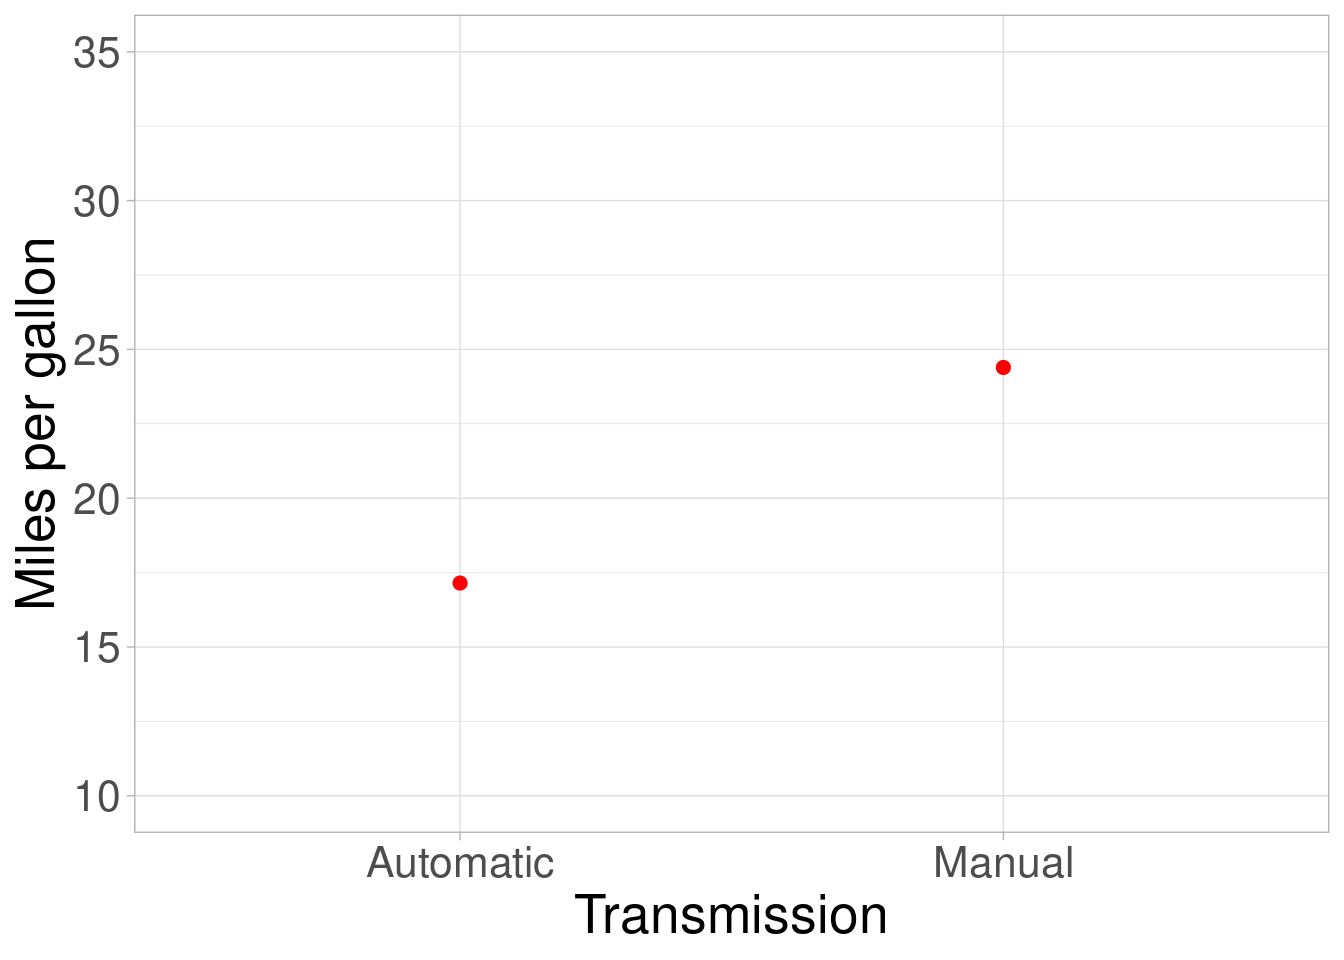
The underlying question is: Are these 2 values statistically different? We can test for it, using a t-test!
Using a t-test, we can find that the magnitude of the difference between groups is 7.245, which is unlikely to be found by chance. If our assumptions hold, the probability of finding such a difference when there is none is p=0.001.
On the other hand, we could be interested in studying the relationship between two continuous variables. The nature of these variables is fairly different from discrete ones. Both variables are unconstrained regarding the values they can take (Big, small and fractions allowed!). In this case, we can take a look at how the weight of cars is related to the miles per gallon.
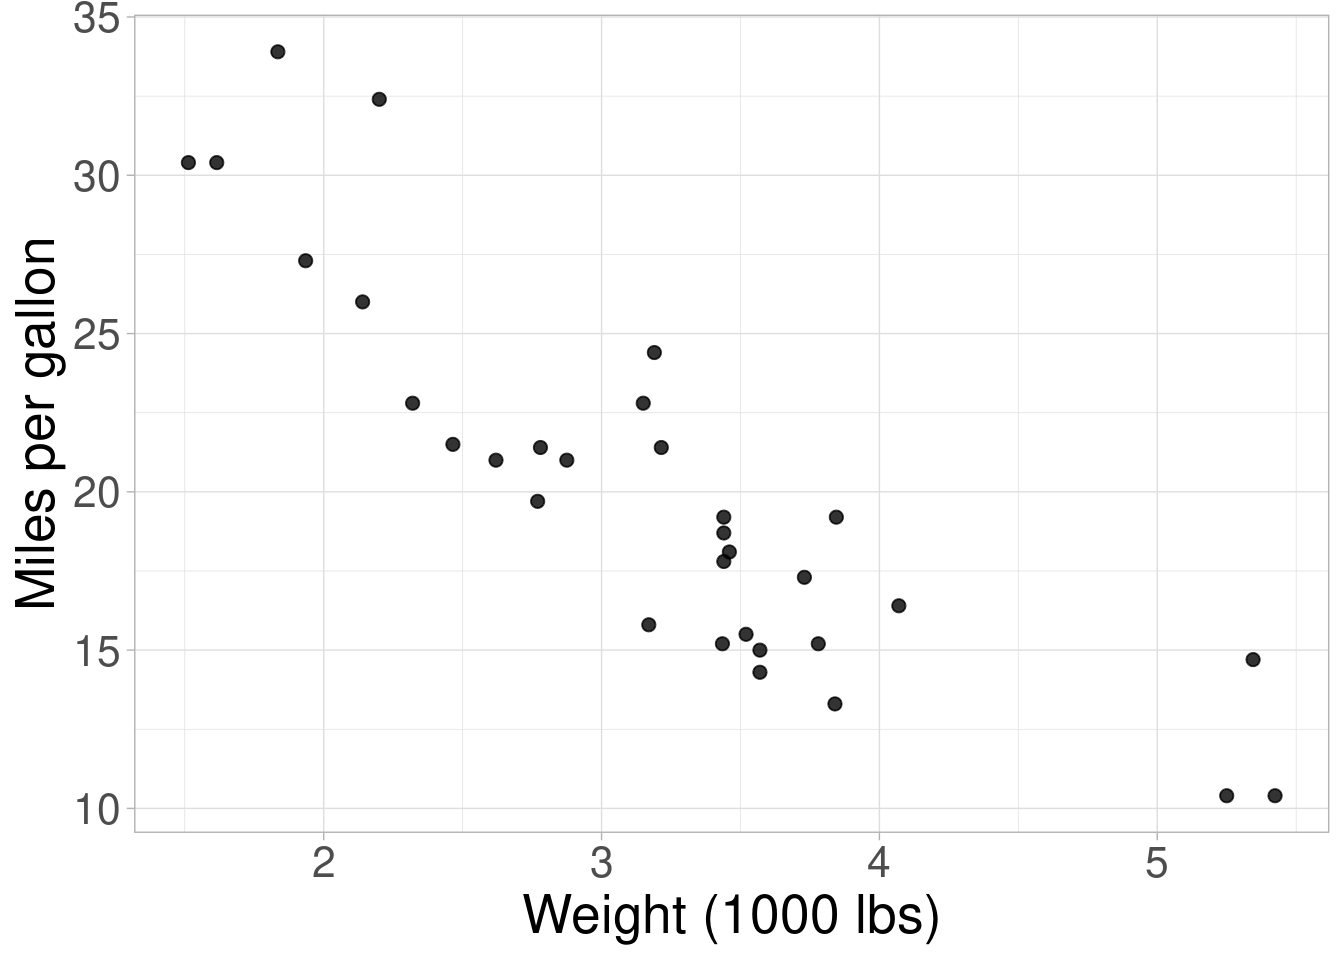
We would see that, overall, heavier cars tend to be able to drive less miles per gallon of gas. In principle, with a correlation analysis we wouldn’t be able to establish causal relationships. Is it the weight causing the mileage per gallon to go down? We can’t address that question with this type of analysis. But we can test whether there is a significant association using a linear correlation test.
The correlation analysis shows a significant negative correlation (r = -0.868), which is different from zero, unlikely to be found by chance (p = \(1.2939587\times 10^{-10}\)).
Reuse
Citation
BibTeX citation:
@online{andina2018,
  author = {Andina, Matias},
  title = {T-Tests for Correlation},
  date = {2018-04-20},
  url = {https://matiasandina.com/posts/2018-04-20-t-test-correlation},
  langid = {en}
}
For attribution, please cite this work as:
Andina, Matias. 2018. “T-Tests for Correlation.” April 20,
2018. https://matiasandina.com/posts/2018-04-20-t-test-correlation.