People say that if you have to explain a joke, it loses value. Probably true. I guess I just wanted to partially comment on how different disciplines analyze different levels of complexity.
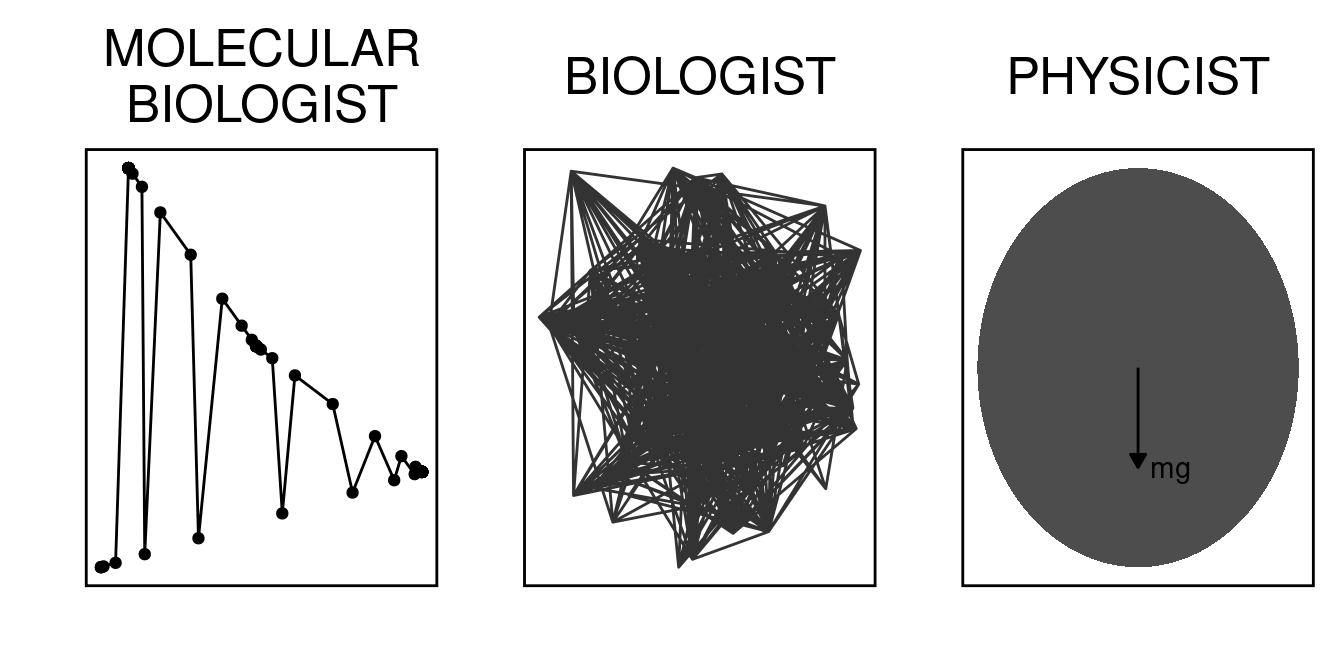
As molecular biologist, I think we were trained to seldom think about the whole system, we were trained to just give up complexity and focus on a couple of fancy names (yes, YFG fits pretty well as the center of this Universe). Genes are awesome, weak protein-protein interactions and conformational changes rock. Are you missing the whole world by focusing too much?
As a biologist, I think we were trained by association (i.e., “If this, then that. Now repeat logic for a million different processes”). This means that our view of every phenomenon tends to be overly complicated. We do this at every scale we analyze Life, not always with the study complexity in mind, but just as a reflex. This is not an intrinsic fault of the biologist, it might be just a result of how data is collected and the empirical nature of the field.
I think physicists get it often right, as simple as it should be, not less. If the whole thing is a tennis ball, and your system of interest is ruled by macro laws, just approximate and do \(m\vec{g}\).
All in all, this is the same dataset, 3 worlds apart (or 3 convention centers apart). I think the joke is on us :smile:.
For those of you who want to recreate, you can find the R code below:
Code
library(tidyverse)
library(xkcd)
library(patchwork)

set.seed(2)
df <- tibble(
  x = rnorm(100, 0, 2),
  y = rnorm(100, 0, 2)
) %>%
  mutate(time = 1:n())
df <- tweenr::tween_along(df,'cubic-in-out', 1000, along = time)


my_theme <-
  theme_xkcd()+
  theme(panel.border = element_rect(fill=NA, color="black", size=1),
        axis.text = element_blank(),
        axis.ticks = element_blank(),
        plot.title = element_text(hjust = 0.5))


p0 <- ggplot(df %>% slice(1:100), aes(x,y))+
  geom_jitter()+
  geom_line(position="jitter")+
  my_theme+
  labs(title="MOLECULAR\nBIOLOGIST", x="", y="")

p1 <- ggplot(df %>% sample_n(1000), aes(x,y))+
  geom_path(lwd=0.5, alpha=0.8)+
  my_theme+
  labs(x="",y="",title="BIOLOGIST")

p2 <- ggplot()+
  ggforce::geom_circle(aes(x0=0,y0=0,r=1), fill="gray30", color=NA)+
  geom_segment(aes(x=0, xend=0, y=0,yend=-0.5),
               arrow = arrow(length = unit(0.2, "cm"),
                             type = "closed"),
               arrow.fill = "black", size=0.5, color="black")+
  geom_text(aes(x=0.2,y=-0.5), label="mg", color="black")+
  my_theme +
  labs(x="", y="", title="PHYSICIST")

p0 + p1 + p2
Reuse
Citation
BibTeX citation:
@online{andina2020,
  author = {Andina, Matias},
  title = {Complex {Fun}},
  date = {2020-04-30},
  url = {https://matiasandina.com/posts/2020-04-30-complex-fun},
  langid = {en}
}
For attribution, please cite this work as:
Andina, Matias. 2020. “Complex Fun.” April 30, 2020. https://matiasandina.com/posts/2020-04-30-complex-fun.